THE IN brought together three public sources to show what can be said about individual sports once the overall audience figures for the Games are set aside. The study set out to document the 32 sports on the Paris programme while retaining the individual disciplines identified in the sources. The published evidence does not cover every sport in the same detail: some reports list only the leading disciplines, while others combine several sports under a single heading. The three tables below preserve those distinctions.
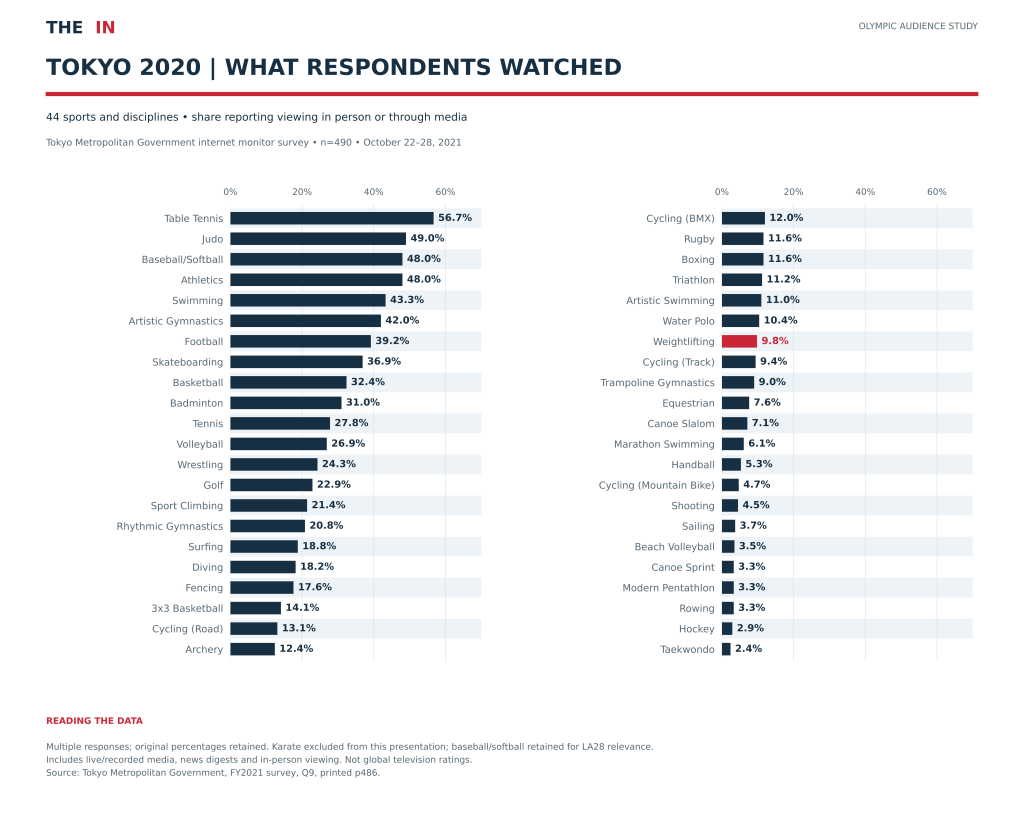
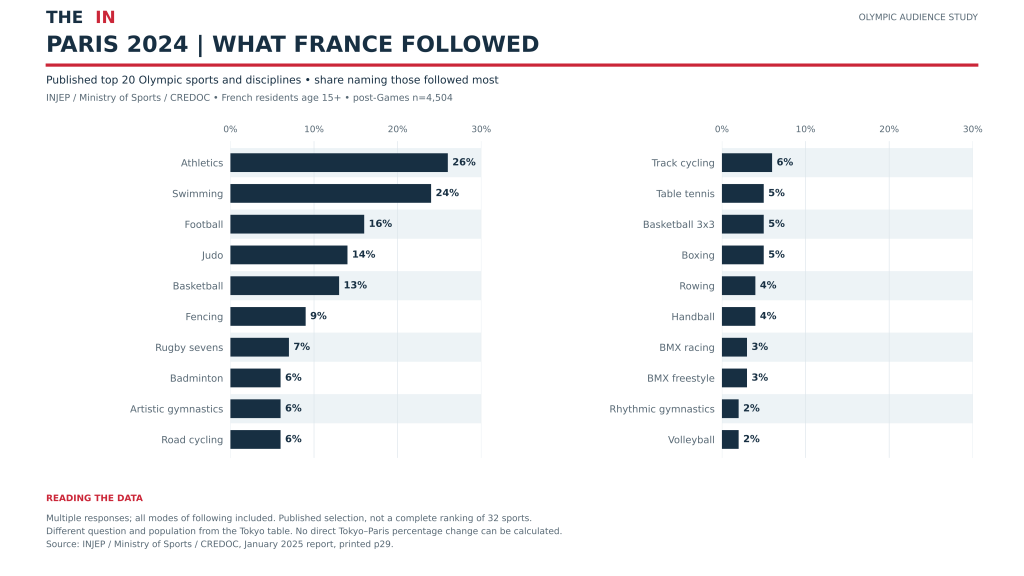
Table tennis led a Tokyo survey of Olympic viewing, with 56.7% of respondents saying they had watched it. In a separate French survey after Paris 2024, athletics (26%), swimming (24%) and football (16%) were the disciplines most often named when respondents were asked which they had followed most. The two results offer different views of Olympic attention: one records what a local panel in Tokyo watched, while the other asks people in France which disciplines they followed most closely.
What Tokyo’s local survey captured
The Tokyo Metropolitan Government asked 490 members of its online panel which Olympic categories they had watched in person or through the media. The survey ran from 22 to 28 October 2021 and allowed more than one answer. Its figures describe the experience of that local panel, rather than a national audience across Japan, and include viewing beyond live television.
Judo placed second on 49.0%, while baseball/softball and athletics shared third place on 48.0%. The survey also reports individual results for skateboarding (36.9%), sport climbing (21.4%) and surfing (18.8%), three sports that are grouped with others in the supplementary Paris evidence. Table 1 retains 44 of the 45 sporting categories in the original survey, following the study’s decision to exclude karate. Baseball/softball remains in the table because it returns at Los Angeles 2028. Its absence from Paris does not represent a zero audience.
What French respondents followed at Paris 2024
The study published by INJEP, the French Ministry of Sports and CRÉDOC asked which Olympic disciplines respondents had followed most. The post-Games survey covered 4,504 people aged 15 and over in France. The published percentages refer to the full population represented by the survey, including people who did not follow the Games. They therefore answer a different question from how many viewers watched a particular competition live.
Behind athletics, swimming and football, judo recorded 14% and basketball 13%. The report lists road and track cycling separately, and distinguishes BMX racing from BMX freestyle. Artistic and rhythmic gymnastics also have separate entries. Keeping those categories intact matters: adding their percentages would risk counting some respondents twice. The report publishes only the 20 most followed disciplines, so a sport’s absence from the table does not mean that nobody followed it.
A second Paris survey fills some gaps
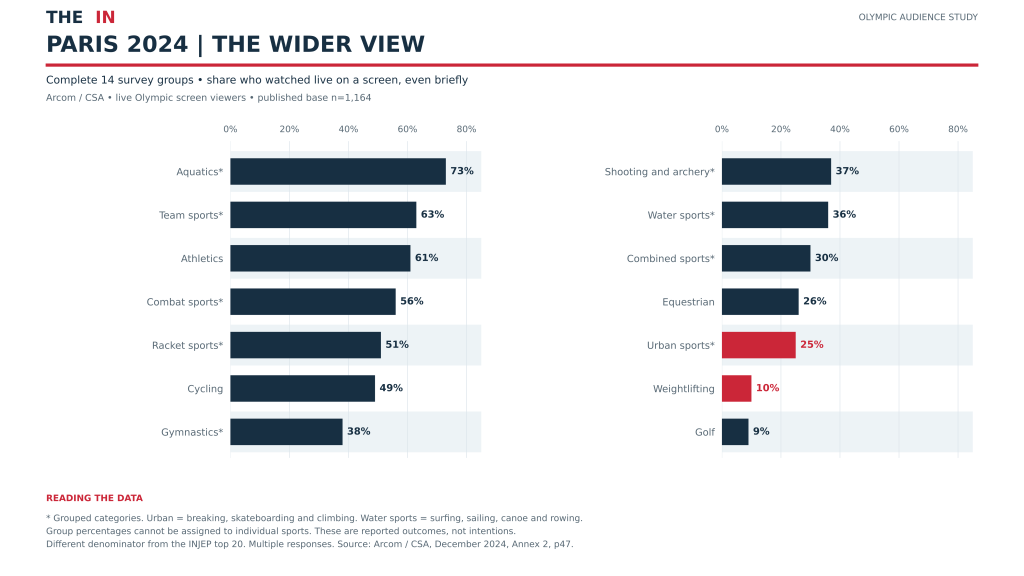
A separate post-Games study by Arcom and CSA asked people which disciplines they had watched live on a screen, even briefly. Its results are based on 1,164 respondents who had watched live Olympic coverage on a screen. Among them, 26% reported watching equestrian, 10% weightlifting and 9% golf. These are reports of viewing that had already taken place. Weightlifting’s 10% cannot be inserted into the INJEP ranking because the two surveys asked different questions of different populations.
The Arcom/CSA study also shows where the available detail stops. Its urban sports category, selected by 25% of those viewers, combines breaking, skateboarding and sport climbing. Its water sports category, at 36%, includes surfing, sailing, canoe and rowing. The survey does not say how many people watched each sport within those groups. Comparing skateboarding’s 36.9% in the Tokyo panel with the 25% for urban sports in Paris would therefore tell us nothing about whether skateboarding gained or lost viewers between the Games.
Why the percentages cannot be compared directly
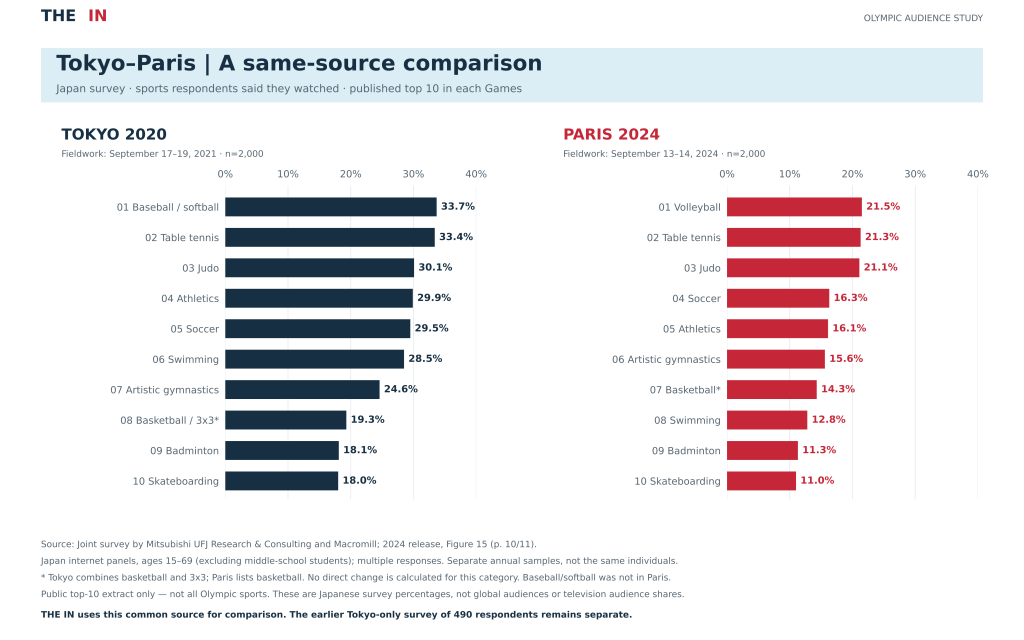
Even when two tables use the same sport name, the underlying figures can mean different things. Athletics was watched by 48.0% of the Tokyo panel, named among the disciplines most followed by 26% in the INJEP study and watched live on a screen by 61% of the Arcom/CSA viewer base. Each figure is useful within its own survey. Subtracting one from another would confuse differences in the questions and the people surveyed with changes in audience.
The same distinction applies to other forms of audience evidence. Reach measures how many people were exposed to coverage; average and peak audiences describe different aspects of viewing; audience share, hours watched, streaming use and social activity each measure something else. A Games-wide audience total cannot be apportioned to individual sports using their number of events, airtime or presumed popularity. Nor can percentages from multiple-response questions be added to estimate the combined audience for two sports.
What the evidence can tell federations
The source register records the publisher, Games edition, market, population, platform, reporting period, unit of measurement and original category for each observation. THE IN kept sports, disciplines and individual events distinct, preserved the published percentages and ranked results only within the same source. Equal percentages share a rank. Where a source does not give a separate figure, the register leaves the observation blank. This gives federations a way to identify which figures they can use and where they still need better evidence.
The performance of home athletes, broadcast scheduling and the availability of coverage are all worth examining when a sport attracts particular attention in one market. The surveys cannot isolate the effect of any of them, and a single national survey cannot establish a sport’s Olympic value. The next step for THE IN is to find repeated measurements for individual sports in compatible markets, using equivalent populations, platforms and reporting periods. The proposed Olympic Audience Power Index remains a research framework with provisional weights; this study publishes no composite score.
 Last related articles